This site is not supported by your current browser.
Please use one of these browsers.


6 Critical Risks in Biogas Project Development
Article written by anessa
Managing a biogas project from an interesting idea to an operational facility is a long journey full of many challenges. Throughout its expansive growth, the industry has learned how to manage this variability, but what if there was a more comprehensive way to approach project variability?
Predictive analytics, data visualization, and artificial intelligence (AI) can be used to quantify these risks and their impact. By enabling project stakeholders to have a more comprehensive look at their project and its risks these solutions can enable data-driven decision making leading to realistic project development and sustainable long-term management.
In this article, we will uncover six critical risk areas in biogas project development. Beyond their impact on the smooth progress of a biogas plant, our experts quantified the financial impact that these risk areas could bring to a project. To explore the effect that these items can have we created a simulation of a baseline project, this project had the following considerations:
- Gas production of 303,000 MMBtu
- -20 CI Score
- An EBITDA of $2,640,422
- An IRR of 18.6%
At first glance, this project looks attractive and like a feasible idea. Let’s take a look at how this changes when faced with critical risks and their effects.
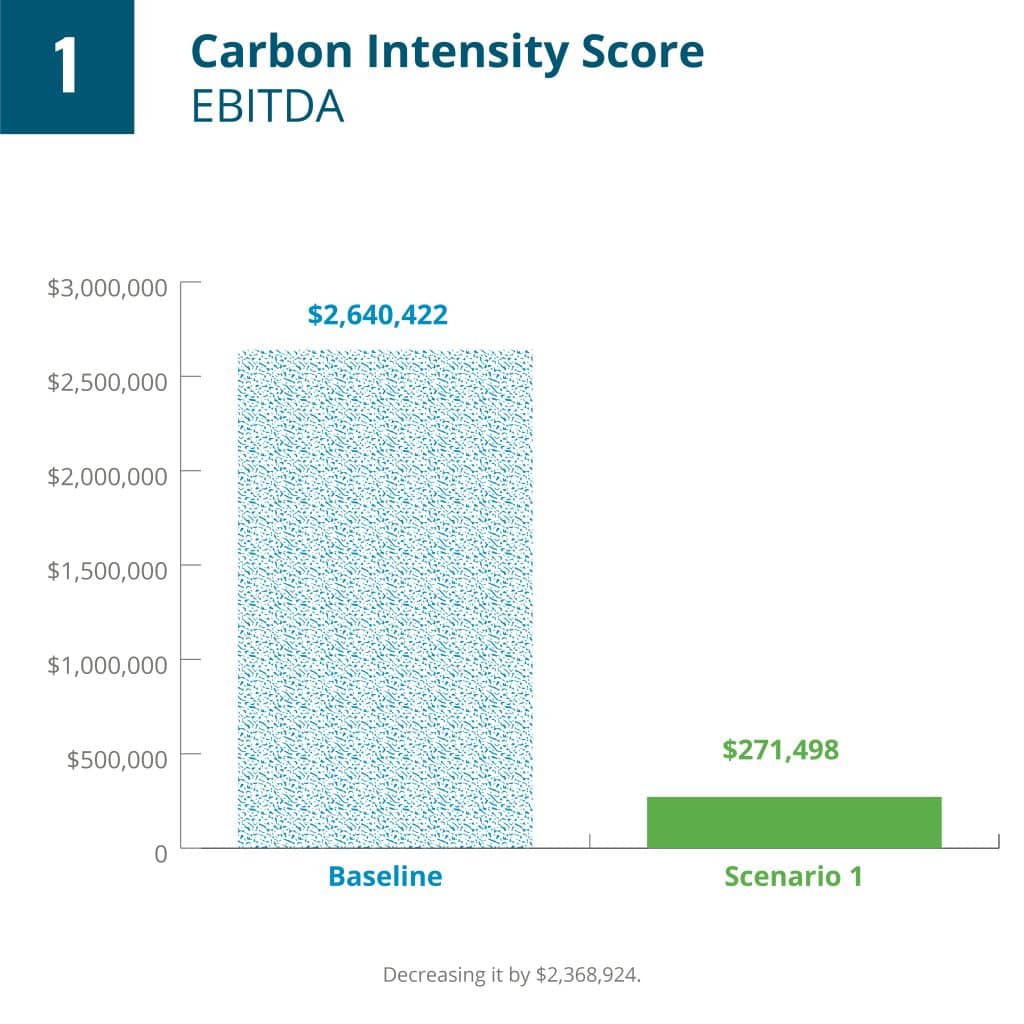
1. Higher CI Score
A Carbon Intensity score is used to measure all GHG emissions associated with the production, distribution, and consumption of a fuel. In the North American market, this value is key since it is a pillar in the calculations for California’s LCFS and Canada’s CFR, incentives that are key to the financial planning biogas opportunities in the US & Canada. This value is calculated by aggregating the carbon emitted during the entire value chain of gas production, including transportation, distribution and even flare. In the preliminary stages of project development, it is hard to get an exact CI score. Most commonly we observe the following can happen with CI Scores:
- Overestimated CI score
- Overestimated CFR credits
- Underestimated consumed fuel usage in the planning phase
- Unexpected feedstock changes due to the lack of planning
- Transportation changes or underestimation
Estimations are often used during the pre-feasibility stage but let’s explore the impact that a higher CI Score would have on a project:
- Changes EBITDA to $271,498 (decreasing it by $2,368,924)
- Changes the IRR to -20.3% (reduced by -38.9%).
2. Lower Feedstock Quality
Feedstock is a cornerstone of all biogas projects, variability in feedstock quality can lead to changes in gas production which compromise the financial viability of your potential project. It is hard to maintain feedstock quality as a static value which makes it even more instrumental to explore potential risks associated with this value. In our experience, changes in feedstock quality normally occur due to:
- Individual feedstock quality changes
- Seasonality quality changes
- Feedstock recipe changes
- Loss of volatile solid during the process
- Feedstock pre-treatment
- Feedstock storage
While exploring the effect of this value at a more granular level in a simulated stress test of our baseline project we found the following:
- Changes EBITDA to $858,832 (decreasing it by $1,781,591)
- Changes the IRR to -5.1% (reduced by -23.8%)

3. Higher Gas Floor Price
The gas floor price is the minimum agreed-upon price for which a biogas site can sell its gas. This value is usually determined during negotiations with energy companies during the evaluation of a project. It is instrumental for the success of a biogas plant producing RNG to finalize this contract since it provides a reliable source of revenue that can be accounted for when stress testing the project. In our evaluation of biogas projects we have seen this value change under the following circumstances:
- Lack of biogas plant business case evaluation
- Set contract values based on underestimated biogas plant IRR
As a key value during the evaluation of the project’s viability and an instrumental component of the project’s revenue, changes in this value can yield big changes in the project’s financial performance. Within our simulation, we found the effect to be the following:
- Changes EBITDA to $1,125,378 (decreasing it by $1,515,044)
- Changes the IRR to -0.6% (reduced by -19.2%)

4. Higher CAPEX
Capital expenditures and their estimations are well-known variables associated with project risks. Technology and plant setup costs can be significant, and costs for technology can vary greatly depending on your project’s needs. Technology prices are variable until you are in the stage of the project’s assessment where you are engaging directly with technology providers and procuring quotes directly from the source. We have seen fluctuations in CAPEX from original estimations under the following scenarios:
- Oversize and overestimated design
- Lack of proper technology evaluation and selection based on feedstock, products and project requirement
When applied to action we found that although CAPEX had an impact on our baseline’s financial variability it was not as significant as the variables covered above. We believe this is due to CAPEX being a consideration only at the start of the project whereas the data shows that other issues can affect the operation year over year. In general, an overestimation in CAPEX can yield the following:
- CAPEX Overestimated by $4,640,000
- Changes the IRR to 10% (reduced by -8.7%)

5. Lower Plant Efficiency
Going from planning into reality can be a challenge with notable impacts on the project’s capacity to maintain production at an expected level. Without the use of a software simulation, it can be challenging to pinpoint which variables will affect your plant’s efficiency aside from obvious culprits like feedstock and issues in your bioconversion process. The following scenarios can impact your project’s efficiency:
- Efficiency loss during operation due to design inefficiencies
- Flaring due to lack of planning
- Unpredicted costs due to lack of planning (e.g., digestate handling costs)
Within our baseline project, we found that changes in plant efficiency can create variability in expected returns to the following degree:
- Changes EBITDA to $2,129,851 (decreasing it by $510,571)
- Changes the IRR to 12.9% (reduced by -5.7%)

6. Loss of Available Feedstock
As one of the cornerstones in project success, a stable feedstock supply can make or break your project. Proactive feedstock planning is gaining traction as the industry recognizes the variability that changes in your feedstock recipe can bring. In terms of feedstock changes we have identified the following as possible common situations:
- Lack of performing feedstock planning optimization
- Not securing the right amount of feedstock in the planning stage
- Not securing suitable feedstocks in the planning stage
- Not performing the economic optimization of feedstock planning
We created a scenario to explore what it would mean for our baseline project to lose some of its available feedstock. When modelling this what-if situation we observed the following effects on our EBITDA and IRR
- Changes EBITDA to $2,244,359 (decreasing it by $396,063)
- Changes the IRR to 14.2% (reduced by -4.4%)

When taking into account all potential risks and their effect on our baseline project we found up to $12M of unforeseen costs or overstated revenues. As we saw above, overestimations and miscalculations can hurt your project’s performance when compared to preliminary calculations year-over-year. To strengthen our industry on a go-forward basis it is imperative for us to use the arsenal at our disposal. Simulation software can be used to help you peek into the future to get a more comprehensive perspective on potential risks and their impact on your project’s technical and financial performance.
ABOUT ANESSA
anessa specializes in developing software solutions for the biogas industry, encompassing different stages in a project’s lifetime from the initial evaluation to proactive operational feedstock planning and real-time monitoring. Our primary objective is to facilitate your growth by making each stage of the project lifetime approachable, easier to communicate, and manageable to report on. Our online solutions provide secure and robust simulations & dynamically visualized dashboards, empowering operators, developers, off-takers, and other entities within the biogas market to explore their potential with confidence.
To see more articles and press releases, please go to Biogas Community’s blog.